@Jérémie Ochin was kind enough to write code to generate the following heatmap from an export of plate-solutions that I provided.
I think it's rather awesome and really shows which parts of the sky are underrepresented. Remember to use the click-and-drag zoom to move around :-)
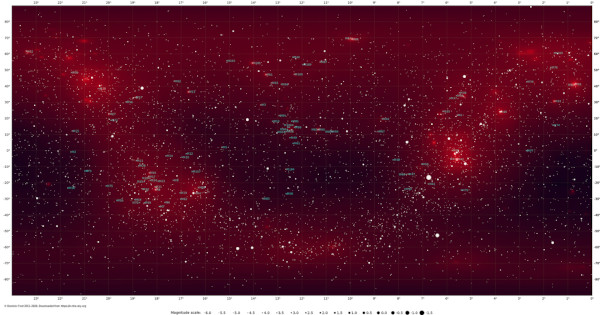
Thanks, Jérémie!
What do you all think?
|
You cannot like this item. Reason: "ANONYMOUS".
You cannot remove your like from this item.
Editing a post is only allowed within 24 hours after creating it.
You cannot Like this post because the topic is closed.
Thanks Jérémie, this is very interesting. Is there a plan to keep an update of this as part of Astrobin. I think there is utility in this, might be interesting to have tabular data available as well...
Dave
|
You cannot like this item. Reason: "ANONYMOUS".
You cannot remove your like from this item.
Editing a post is only allowed within 24 hours after creating it.
You cannot Like this post because the topic is closed.
|
Really interesting. Thank you for sharing
|
You cannot like this item. Reason: "ANONYMOUS".
You cannot remove your like from this item.
Editing a post is only allowed within 24 hours after creating it.
You cannot Like this post because the topic is closed.
Thanks Jérémie, this is very interesting. Is there a plan to keep an update of this as part of Astrobin. I think there is utility in this, might be interesting to have tabular data available as well...
Dave
Hi Dave,
Thanks for your feedback and interest.
About the frequency of update, I guess it will depend from Salavatore and probably from the interests from the community with this « data representation ». The code is published on Github, so anyone with the data - and time to setup OpenCV on Python with all the versionning issues :-) - can play with that.
I am of course ready to run the code again, maybe once a month (this high resolution map took 12hours of calculation - poor coding probably - but the runtime is % to the image area, so half the size is manageable on my side more often). But given the high number of pictures, I am not sure you will notice much difference in the map between 2 consecutive months. Except if people drastically change their behaviors using the map (?).
Anyway, I think fun things could be done with these data or with extended data :
- a map of the average number of likes per « pixel of sky » (to be independent of the number of pictures taken of a given area of the sky)
- an index of each astrophotographer based on : the % of the sky its pictures cover altogether, each pixel weighted by (i) its « marginal contribution » to the imaging of this area (so for each pixel of sky he photographed, we can check how much it contributes to the knowledge of this area : 1 new picture of a pixel of sky already taken 10 times will weight more than 1 picture of Orion taken 10000 times); and (ii) the resolution of its picture (a large mosaic requires much more work than the same area taken one shot with a smaller focal length)
I think we can have endless ideas, but I stop there because the forum talking about Astrobin is now closed :o) All apologies Salvatore !
Jeremie
|
You cannot like this item. Reason: "ANONYMOUS".
You cannot remove your like from this item.
Editing a post is only allowed within 24 hours after creating it.
You cannot Like this post because the topic is closed.
|
Thanks @Jérémie Ochin, what is your GitHub repository? I can't promise anything, but I may give a try to speedup things.
|
You cannot like this item. Reason: "ANONYMOUS".
You cannot remove your like from this item.
Editing a post is only allowed within 24 hours after creating it.
You cannot Like this post because the topic is closed.
You cannot like this item. Reason: "ANONYMOUS".
You cannot remove your like from this item.
Editing a post is only allowed within 24 hours after creating it.
You cannot Like this post because the topic is closed.
Die Launische Diva:
Thanks @Jérémie Ochin, what is your GitHub repository? I can't promise anything, but I may give a try to speedup things.
The repository is here :
https://github.com/JeremieOchin/MapOfTheMostVisitedSkyAreas
Not sure I uploaded the latest scripts, and I just had troubles upgrading my workstation from W7 to W10 this week end (to install PixInsight, as they explain they don’t support W7 anymore :-) ), so I will have reinstall everything prior to any improvements.
My personal next step is to make my own background for the skymap, using a file containing the coordinates of all Messier and NGC objects. For this image I have used one found on internet, available for download, but not sure about copyrights issues. I prefer things to be clear...
|
You cannot like this item. Reason: "ANONYMOUS".
You cannot remove your like from this item.
Editing a post is only allowed within 24 hours after creating it.
You cannot Like this post because the topic is closed.
Saw on another post you were looking for a new logo.
I just doodled one quickly on my iPad with Procreate, using the heatmap :-)
I kept the Saturn and the colors of the site.
 |
You cannot like this item. Reason: "ANONYMOUS".
You cannot remove your like from this item.
Editing a post is only allowed within 24 hours after creating it.
You cannot Like this post because the topic is closed.
|
That's really a neat idea, thanks! It needs some polishing and a way to make it work in a small size, but I like the premise. I will think about this, thanks!
|
You cannot like this item. Reason: "ANONYMOUS".
You cannot remove your like from this item.
Editing a post is only allowed within 24 hours after creating it.
You cannot Like this post because the topic is closed.
@Jérémie@Salvatore Iovene I am wondering if the spreadsheet data is still available? I love this idea, and have come across it while researching a related idea I had this afternoon ... it would be fantastic to be able to correlate the imaging data with the catalogue data I have downloaded elsewhere.
Many thanks in advance, and clear skies.
Todd
|
You cannot like this item. Reason: "ANONYMOUS".
You cannot remove your like from this item.
Editing a post is only allowed within 24 hours after creating it.
You cannot Like this post because the topic is closed.
I did the same thing with astrometry.net submissions - maybe you could add the data contained in the file linked to in the README to your image!
https://github.com/void4/astroheat |
You cannot like this item. Reason: "ANONYMOUS".
You cannot remove your like from this item.
Editing a post is only allowed within 24 hours after creating it.
You cannot Like this post because the topic is closed.
I did the same thing with astrometry.net submissions - maybe you could add the data contained in the file linked to in the README to your image!
https://github.com/void4/astroheat
Nice! Probably close to a million images in that dataset come from AstroBin 😁
|
You cannot like this item. Reason: "ANONYMOUS".
You cannot remove your like from this item.
Editing a post is only allowed within 24 hours after creating it.
You cannot Like this post because the topic is closed.
Salvatore Iovene:
@Jérémie Ochin was kind enough to write code to generate the following heatmap from an export of plate-solutions that I provided.
I think it's rather awesome and really shows which parts of the sky are underrepresented. Remember to use the click-and-drag zoom to move around :-)
Thanks, Jérémie!
What do you all think?
Awesome indeed! Nice work @Jérémie Ochin
(of course there is a reason certain parts of the sky are underrepresented... 😉)
|
You cannot like this item. Reason: "ANONYMOUS".
You cannot remove your like from this item.
Editing a post is only allowed within 24 hours after creating it.
You cannot Like this post because the topic is closed.
|
Great! Gives us all targets to think about.
|
You cannot like this item. Reason: "ANONYMOUS".
You cannot remove your like from this item.
Editing a post is only allowed within 24 hours after creating it.
You cannot Like this post because the topic is closed.
You cannot like this item. Reason: "ANONYMOUS".
You cannot remove your like from this item.
Editing a post is only allowed within 24 hours after creating it.
You cannot Like this post because the topic is closed.
|
It would be nice to have a "random rare field" generator, that takes the inverse of the number of existing observations of each "bin"/region (looks like there are 2550*4200 =10,710,000 in your v2?) and then did a random weighted choice https://www.w3schools.com/python/ref_random_choices.asp |
You cannot like this item. Reason: "ANONYMOUS".
You cannot remove your like from this item.
Editing a post is only allowed within 24 hours after creating it.
You cannot Like this post because the topic is closed.
Very cool, thank you all  |
You cannot like this item. Reason: "ANONYMOUS".
You cannot remove your like from this item.
Editing a post is only allowed within 24 hours after creating it.
You cannot Like this post because the topic is closed.
Anyone? Anyone? Buehler? Buehler?
Sincerely,
Bootes
|
You cannot like this item. Reason: "ANONYMOUS".
You cannot remove your like from this item.
Editing a post is only allowed within 24 hours after creating it.
You cannot Like this post because the topic is closed.
I did the same thing with astrometry.net submissions - maybe you could add the data contained in the file linked to in the README to your image!
https://github.com/void4/astroheat
Wow, what a wonderful set of heatmaps! These could be very helpful in choosing where to look to increase the chances of finding something new;-))
|
You cannot like this item. Reason: "ANONYMOUS".
You cannot remove your like from this item.
Editing a post is only allowed within 24 hours after creating it.
You cannot Like this post because the topic is closed.
to create to post a reply.


