|
Thanks very much for contributing this to the community. I gave it a try this morning, substituting the GHS script for my usual masked stretch in PI, and was really happy with the result: https://astrob.in/37u4dg/D/ |
You cannot like this item. Reason: "ANONYMOUS".
You cannot remove your like from this item.
Editing a post is only allowed within 24 hours after creating it.
You cannot Like this post because the topic is closed.
Barry Wilson:
Mike - thank you very much for your efforts in creating this versatile script. I have downloaded ver2 this week and following your tutorial I have processed a couple LRGB images and I have been impressed with my results on quite faint tricky targets.
If it's of any interest for performance, I have in the last couple of weeks bought a new Apple 14" MacBook Pro using the M1 Pro chip and GHS works very well.
I am not sure if I have spotted an issue though, after using GHS I had an error message regarding a 'preview' when I was using the Colour Mask script. When I do not use GHS I do not receive the 'error' message. I will note more detail if I get a chance tomorrow to process data and will update this thread. The error message reported by PI did not appear to affect the performance of any process or script. So it may be trivial if there is indeed some sort of issue.
Regardless of the above, the GHS script will be forming a routine part of my processing workflow. Thanks once again.
Cheers, Barry
Many thanks for the feedback Barry - I am glad you have had good results from GHS. Please do let me know if you are able to reproduce the issue when using ColourMask. It would be good if you could let me know as much info as you can on what you were doing (happy for you to send me a PM if you like) - I can't really think from your description what the issue might be. It would be good to know the exact error message if you have a note of that.
|
You cannot like this item. Reason: "ANONYMOUS".
You cannot remove your like from this item.
Editing a post is only allowed within 24 hours after creating it.
You cannot Like this post because the topic is closed.
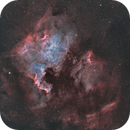
Thanks very much for contributing this to the community. I gave it a try this morning, substituting the GHS script for my usual masked stretch in PI, and was really happy with the result: https://astrob.in/37u4dg/D/
You are very welcome - I am glad it has worked well for you. I like your California Nebula processing there - it's great to see images that GHS has had a hand in producing!
|
You cannot like this item. Reason: "ANONYMOUS".
You cannot remove your like from this item.
Editing a post is only allowed within 24 hours after creating it.
You cannot Like this post because the topic is closed.
|
Thank you so much for this great script! I just used GHS on my latest picture. I am relatively new to pixinsight (and astrophotography in general) and played around with different stretching methods a lot. Until now, i was never completely happy with the existing methods and always did the final stretch in Affinity. This changed now with GHS: Perfect control over the stretches, no more star bloat, arcsinh stretch wthout artefacts in bright stars. For me, this is the perfect tool for stretching!
|
You cannot like this item. Reason: "ANONYMOUS".
You cannot remove your like from this item.
Editing a post is only allowed within 24 hours after creating it.
You cannot Like this post because the topic is closed.
Thank you so much for this great script! I just used GHS on my latest picture. I am relatively new to pixinsight (and astrophotography in general) and played around with different stretching methods a lot. Until now, i was never completely happy with the existing methods and always did the final stretch in Affinity. This changed now with GHS: Perfect control over the stretches, no more star bloat, arcsinh stretch wthout artefacts in bright stars. For me, this is the perfect tool for stretching!
Thanks for the feedback Andresch. The GHS equations are natural transforms for the stretching process; always increasing, true functions (not relations), continuous and smooth both in brightness and contrast (1st derivative), precise (in theory you could "draw" a curve but impossible practically), no clipping/data loss and no point interpolation issues. They were borrowed from other technical fields associated with forecasting natural processes, with a bit of twist - the ability to control the contrast/brightness addition and place the maximum contrast wherever you want. This math, combined with Mike's extraordinary ability to envision and program a great interface make it a fantastic tool, in my (albeit biased) opinion.
|
You cannot like this item. Reason: "ANONYMOUS".
You cannot remove your like from this item.
Editing a post is only allowed within 24 hours after creating it.
You cannot Like this post because the topic is closed.
Thank you so much for this great script! I just used GHS on my latest picture. I am relatively new to pixinsight (and astrophotography in general) and played around with different stretching methods a lot. Until now, i was never completely happy with the existing methods and always did the final stretch in Affinity. This changed now with GHS: Perfect control over the stretches, no more star bloat, arcsinh stretch wthout artefacts in bright stars. For me, this is the perfect tool for stretching!
That's really good to hear Andresch - I am pleased GHS is working well for you.
|
You cannot like this item. Reason: "ANONYMOUS".
You cannot remove your like from this item.
Editing a post is only allowed within 24 hours after creating it.
You cannot Like this post because the topic is closed.
Thanks very much for contributing this to the community. I gave it a try this morning, substituting the GHS script for my usual masked stretch in PI, and was really happy with the result: https://astrob.in/37u4dg/D/
Wonderful image, JDJ. Thanks for the great example of the use of GHS to put contrast right where it is needed to display the complexity of the nebula.
|
You cannot like this item. Reason: "ANONYMOUS".
You cannot remove your like from this item.
Editing a post is only allowed within 24 hours after creating it.
You cannot Like this post because the topic is closed.
|
Hi David & Mike - I carried out another short test yesterday evening using GHS on an RGB image followed by Colour Masks and there were no errors reported in PI's Process Console. Good news. Sorry for raising a false alarm! I will post again though if I see anything unusual. Thank you both & CS!
|
You cannot like this item. Reason: "ANONYMOUS".
You cannot remove your like from this item.
Editing a post is only allowed within 24 hours after creating it.
You cannot Like this post because the topic is closed.
Barry Wilson:
Hi David & Mike - I carried out another short test yesterday evening using GHS on an RGB image followed by Colour Masks and there were no errors reported in PI's Process Console. Good news. Sorry for raising a false alarm! I will post again though if I see anything unusual. Thank you both & CS!
Thanks for letting us know Barry, that is good news! (not much CS here at the moment  , but hope yours are clearer!) , but hope yours are clearer!)
|
You cannot like this item. Reason: "ANONYMOUS".
You cannot remove your like from this item.
Editing a post is only allowed within 24 hours after creating it.
You cannot Like this post because the topic is closed.
Widefield NGC7000 HOO
Really great stretching tool! Probably the best out there. Really appreciate the straight forward tutorials as well, they really helped. If you want to see the effect it has on an image I linked one of them above. The original was done with default PixInisght stretch tools, the second with GHS. Notably the stars are much better.
I believe GHS in conjunction with StarNet2 is going to open up a lot of new doors.
|
You cannot like this item. Reason: "ANONYMOUS".
You cannot remove your like from this item.
Editing a post is only allowed within 24 hours after creating it.
You cannot Like this post because the topic is closed.
|
So many great additions in v2. One thing that would be useful in the next version would be a way to send the value you select on the histogram to one or more of the parameters. One thing that's still painful (and the videos make this clear) is having to type values that you discover you want to use into the SP or other fields manually. A click-and-send functionality would really speed things up.
|
You cannot like this item. Reason: "ANONYMOUS".
You cannot remove your like from this item.
Editing a post is only allowed within 24 hours after creating it.
You cannot Like this post because the topic is closed.
Roman Pearah:
So many great additions in v2. One thing that would be useful in the next version would be a way to send the value you select on the histogram to one or more of the parameters. One thing that's still painful (and the videos make this clear) is having to type values that you discover you want to use into the SP or other fields manually. A click-and-send functionality would really speed things up.
Thanks Roman. An interesting idea - I will give it some thought!
|
You cannot like this item. Reason: "ANONYMOUS".
You cannot remove your like from this item.
Editing a post is only allowed within 24 hours after creating it.
You cannot Like this post because the topic is closed.
Widefield NGC7000 HOO
First off - what a glorious image. I love the detail and colouring.
Really great stretching tool! Probably the best out there. Really appreciate the straight forward tutorials as well, they really helped. If you want to see the effect it has on an image I linked one of them above. The original was done with default PixInisght stretch tools, the second with GHS. Notably the stars are much better.
I believe GHS in conjunction with StarNet2 is going to open up a lot of new doors.
First off, what a spectacular image. I lovecthecdetail and coloring. The stars are stated nicely.
I agree. One thing I may have seen though is if you use GHS to be particularly gentle on the stars Starnet2 might not recognize them. Maybe Starnet can be sent back to school for a bit of a refresher course on GHS stars. In the meantime, if you intend on using Starnet2 to remove stars, don't be too overprotective on them.
Let me know if you have the same experience.
|
You cannot like this item. Reason: "ANONYMOUS".
You cannot remove your like from this item.
Editing a post is only allowed within 24 hours after creating it.
You cannot Like this post because the topic is closed.
I thought people would want to know that Dave Payne has released the next in his GHS2 tutorial series. Dave's tutorial videos now cover the following:
Tutorial 1: Introducing GHS Version 2
Tutorial 2: More advanced stretching
Tutorial 3: More options, colour stretch and image blending
Links to these videos as well as links to the excellent series prepared by Paulyman Astro can be found on the https://ghsastro.co.uk website.
|
You cannot like this item. Reason: "ANONYMOUS".
You cannot remove your like from this item.
Editing a post is only allowed within 24 hours after creating it.
You cannot Like this post because the topic is closed.
Hi Mike,
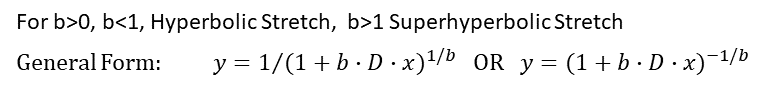
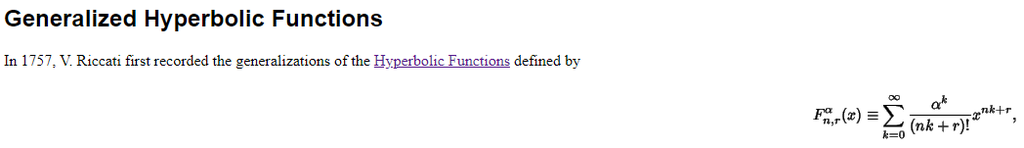
Thank you very much for introducing an excellent generalized form of generating monotonically increased stretching curves. Very very interesting! Just out of curiousity (and I am guessing I wouldn't understand this completely given I have not picked up math textbooks for some 15 years lol), is there a general tutorial/introduction of Generalized Hyperbolic Function and how it's related with equations used in your form (in Figure 15 in the documentation)?
I googled around and found this to be the general definition of a GHF. I can see this turn into the Taylor Series of e^x, cosh(x), sinh(x) etc. at special (a,n,r) cases. How does these values translate to the D & b used in your equation though? I seem fail to see the link between this and the generalized expression you use in your equation (I suppose it's [y=(1+b*D*x)^(-1/b)]?). Also is there a mathmatical reason for the transition between "normal" form & "integral" form b cross 0?
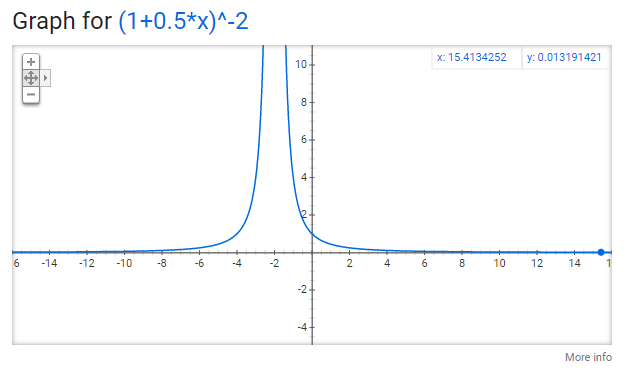
And just to make sure I am not understanding this wrong, for D=1 (Stretch Factor: ln(D+1)=0.69), b=0.5, I should expect y=(1+0.5x)^(-2))? Why google tells me that's a monotonically decreased function between x=[0,1]?

Again totally out of curiousity and I likely wouldn't understand it very well, so I don't want to waste your time typing to answer and explain the whole thing to me; if there is any existing tutorial/paper about this, I'd be very interested!
Thanks,
Yizhou
|
You cannot like this item. Reason: "ANONYMOUS".
You cannot remove your like from this item.
Editing a post is only allowed within 24 hours after creating it.
You cannot Like this post because the topic is closed.
Yizhou Zhang:
Hi Mike,
Thank you very much for introducing an excellent generalized form of generating monotonically increased stretching curves. Very very interesting! Just out of curiousity (and I am guessing I wouldn't understand this completely given I have not picked up math textbooks for some 15 years lol), is there a general tutorial/introduction of Generalized Hyperbolic Function and how it's related with equations used in your form (in Figure 15 in the documentation)?
I googled around and found this to be the general definition of a GHF. I can see this turn into the Taylor Series of e^x, cosh(x), sinh(x) etc. at special (a,n,r) cases. How does these values translate to the D & b used in your equation though? I seem fail to see the link between this and the generalized expression you use in your equation (I suppose it's [y=(1+b*D*x)^(-1/b)]?). Also is there a mathmatical reason for the transition between "normal" form & "integral" form b cross 0?
And just to make sure I am not understanding this wrong, for D=1 (Stretch Factor: ln(D+1)=0.69), b=0.5, I should expect y=(1+0.5x)^(-2))? Why google tells me that's a monotonically decreased function between x=[0,1]?
Again totally out of curiousity and I likely wouldn't understand it very well, so I don't want to waste your time typing to answer and explain the whole thing to me; if there is any existing tutorial/paper about this, I'd be very interested!
Thanks,
Yizhou
Great question and I love this kind of question as it is an excuse to blather on.... Note that below is likely far more information than you wanted, but I thought I would let you know how GHS came about anyways) Don't worry, do really don't need to know it, however, to use GHS and THERE WON"T BE A TEST!
I skipped quite a few steps going from what you show above to the formulation, but I will try and describe them here. Your graph is quite helpful on this. First off, let's only consider the RHS of your plot, with x>0. The rest of the graph we can throw away. From the equation, you can see that when x=0, then y=1 for any value of b and D. Then the graph asymptotically approaches 0, as x goes to infinity, with b and D essentially determining both the slope (how fast y drops from 1 as x moves positive, and how long it takes for the curve to approach 0. By varying b and D, you can achieve a family of curves.
This family of curves generated by has a bunch of properties that describe physical processes and is used in many scientific, business, and medical applications for time series forecasting (substituting t, time for x). Often you can either analytically or empirically determine b and D from early measurements, use y=1 to represent your initial condition and then, with reasonable confidence forecast what the values for y will be in the future. In this form, the equation is known as the "generalised hyperbolic decline formula". All you have to do is substitute 1-y for y and you have a family of curves that all go through the origin and approach 1 at infinite time and you have the "generalized hyperbolic growth formula" Forgive me, but an example application might be forecasting Covid-19 cases or hospitalization models (with y=0 representing no-one has it, and y=1 representing everyone does). In this case b and D are derived from transmissibility, and effectiveness of distancing, masks, immunity, vaccination, etc.)
A couple of special cases of the generalized growth formula, are when b=0 (or rather when b approaches 0), the formula becomes exponential ( y=1-exp(-Dx) ). This is the formula for the growth in amount of a radio-active decay product. It is also the formula for continuous compounding interest rate in economics. Another special case, is when b=1, the formula become "harmonic" or ( y=1-1/(1+Dx) ) - think of a guitar string getting quieter after plucking. When b>=0 and b<=1, the initial slope (derivative) of the function is D and the function is hyperbolic. When b>1, the slope becomes D*b and the curves are deemed "super-hyperbolic. If you are a petroleum/exploitation engineer, you will recognize these as the Arp Equations - if you are a petroleum engineer you can stop laughing now - I are one too. Regardless, the largest slope is always at x=0, and the function is always increasing. It is helpful that the function (important that it isn't a "relation" ie flat or decreasing y with increasing x, which will cause image artifacts) is also integrate-able, differentiable, invertible (can get x from y or y from x) smooth and continuous (at least for x>0).
For application in GHS script and image stretching, we have manipulated the formula so that it only runs from x=0 to x=1, and then linearly normalized the curve so that y(x=1)=1. (Both input and output pixel values can run from 0 to 1). We put sliders in for b and D, to be able to control the slope (amount of contrast) added at x=0 versus what was added at x=1. We also changed the slider from putting D in directly, to putting the log of D in to allow for sensitive input of true linear D at low values of D and also very large values for D. (the actual formula for D input, is shown in the script, but we just call it D anyways - so the work you showed is fine, just substitute ln(D+1) for D in your example) . Another trick we played is used the integral (cumulative) form of the hyperbolic equations when a negative b value is input (a negative b means a positive b with the integral form). In its integral form, a b=1 (input b=-1) yields a logarithmic curve and a b=sqrt(2) yields a decent approximation to arcsinh (for more on this read about Euler's formula - but only if you like math). We're still ok at b=0 because both the hyperbolic and integral hyperbolic forms are exponential. Even the "Histogram Transform" can pretty much be duplicated (it is, in essence, harmonic).
The shape of the resulting curve that I was drawing when I used the curves process, was almost invariably the same shape as the resulting generalized hyperbolic equation, that it inspired me to chase these equations a little for the application of stretching. By basing the curve on b and D however, I could get precision and repeatability that you practically cannot get by drawing curves. (try going from linear, to a decent stretch in one go with curves, and you'll see what I mean). Also, I wouldn't have to deal with spline or linear interpolation - both of which can cause artifacts and destroy data. Finally, no clipping!, at least in RGB/K mode as both x and y run from 0 to 1. That is the basis behind my claim that GHS is a "safe" stretching environment - at least safe for the data - I don't recommend using GHS while skydiving.
Use of the SP slider essentially changes the origin (moves the x=0 point) to allow for the the maximum slope to apply (maximum contrast addition) at any chosen point. For pixels less than SP, the negative mirror image is employed which is symmetric about SP, keeps the same desirable properties of the hyperbolic equations and, in essence, allows for the a typical "S" shaped curve to be applied. With D and b, you control how both how steep the middle of the S is and how curvy the S is. FInally, LP and HP were used where the slope (or derivative) was held constant for x>HP or x<LP - ie contrast reservation through linearization for highlights (brightest stars, nebulae) and lowlights (dim, background) features. Through their effect on normalization, HP and LP also serve to bright or dim the stretch function to help set the "black point" and "white point" - again without clipping. By employing an inverse - an inverted S shape can also be applied.
If you are a geeky applied math guy - another way to look at the GHS transform is as if you were doing a masked stretch, only with an infinite number of masks and/or applied them implicitly (using the results of the stretch before you have them, as the mask) rather than explicitly (using the current image as the mask) as with the "Masked Stretch Process".
So that's how we get from the curves/equations you correctly show, to the GHS input. Hopefully you aren't sorry you asked or read this, I did enjoy typing it. Mike and I didn't really create anything new here, we just "borrowed" from other fields. (Next stop, Laplace transforms rather than Fourier? :-) )
Dave
|
You cannot like this item. Reason: "ANONYMOUS".
You cannot remove your like from this item.
Editing a post is only allowed within 24 hours after creating it.
You cannot Like this post because the topic is closed.
So that's how we get from the curves/equations you correctly show, to the GHS input. Hopefully you aren't sorry you asked or read this, I did enjoy typing it.
Thank you so much Dave for your detailed typing! I don't regret asking at all and enjoyed reading it through, although I perhaps only understand a small portion as expected. It's clear to me that you normalize the function to [(0,0) (1,1)], and now it's clear that you flip the function with (1-y) to make it monotonically increase. Anyway I think this is brillient on using the mathmatical expression to create proper shape of curve for stretching in image processing. I am still learning the use case and see how to best incorporate it in my workflow.
Thanks again for the elaboration.
Yizhou
|
You cannot like this item. Reason: "ANONYMOUS".
You cannot remove your like from this item.
Editing a post is only allowed within 24 hours after creating it.
You cannot Like this post because the topic is closed.
Hi Yizhou,
One thing I did find on the interweb, was a review of research on the eye's response to luminance. There are a lot of plots here that tend to show, at least for the mid range of luminance, either a semi-log straight line which would correspond to an exponential relationship (with a corresponding slope equivalent of "D") or a log-log straight line, which would correspond to a hyperbolic relationship (with a corresponding slope "b"). Can't say that it's justification for using a hyperbolic stretch (which I think would indeed be a "stretch"), just that it's parallel and we don't see perceive light linearly.
Dave
|
You cannot like this item. Reason: "ANONYMOUS".
You cannot remove your like from this item.
Editing a post is only allowed within 24 hours after creating it.
You cannot Like this post because the topic is closed.
|
One thing that was changed with v2 was that the PixelMath processes that are injected into a view's history are no longer fully defined expressions but merely references to a temporary view: _ghs_temp. This prevents using processes from history to stretch other views or from having a real record of the stretches embedded in the image. This might have been a necessary change to support real-time previews or just a performance tweak, but having processes in history that are reusable and self-contained is a preferred pattern I think.
|
You cannot like this item. Reason: "ANONYMOUS".
You cannot remove your like from this item.
Editing a post is only allowed within 24 hours after creating it.
You cannot Like this post because the topic is closed.
Roman Pearah:
One thing that was changed with v2 was that the PixelMath processes that are injected into a view's history are no longer fully defined expressions but merely references to a temporary view: _ghs_temp. This prevents using processes from history to stretch other views or from having a real record of the stretches embedded in the image. This might have been a necessary change to support real-time previews or just a performance tweak, but having processes in history that are reusable and self-contained is a preferred pattern I think.
Hi Roman,
Mike will provide a better answer, and perhaps he can incorporate an option to save the Pixelmath instance as an icon, but such stretches done with Pixelmath would only be applicable for RGB/K and not be valid for Lum, Saturation, or Colour Enhance stretches (at least I don't think) because other processes must also be called.
One change Mike has made is to enable the script to be iconified with the current settings so that it can be applied to another image. Additionally, the icons setting can be extracted from file history for reapplication to a second image. (I am hoping these are effective in the current release, if not they will be in the next release update coming shortly). So while this doesn't/wont have the individual process settings in the history, it will have the script settings in the history.
Another way (that I use, maybe because I am old school) is to save the log of stretches as a text file. I know this isn't as slick, but it also retains what was done to all images, even those instances that create new images - which was . I know this requires one to go through the GUI/script again and enter/set the parameters, so some may not like this. It also has the advantage that it is essentially script version invariant.
A third way is to prepare both images you want to stretch prior to entering the script. You can quickly preview and change the target image to make sure the stretch is appropriate for both images, and then execute sequentially.
Hopefully, one of these is satisfactory in the meantime.
Cheers,
Dave
|
You cannot like this item. Reason: "ANONYMOUS".
You cannot remove your like from this item.
Editing a post is only allowed within 24 hours after creating it.
You cannot Like this post because the topic is closed.
David Payne:
Roman Pearah:
One thing that was changed with v2 was that the PixelMath processes that are injected into a view's history are no longer fully defined expressions but merely references to a temporary view: _ghs_temp. This prevents using processes from history to stretch other views or from having a real record of the stretches embedded in the image. This might have been a necessary change to support real-time previews or just a performance tweak, but having processes in history that are reusable and self-contained is a preferred pattern I think.
Hi Roman,
Mike will provide a better answer, and perhaps he can incorporate an option to save the Pixelmath instance as an icon, but such stretches done with Pixelmath would only be applicable for RGB/K and not be valid for Lum, Saturation, or Colour Enhance stretches (at least I don't think) because other processes must also be called.
One change Mike has made is to enable the script to be iconified with the current settings so that it can be applied to another image. Additionally, the icons setting can be extracted from file history for reapplication to a second image. (I am hoping these are effective in the current release, if not they will be in the next release update coming shortly). So while this doesn't/wont have the individual process settings in the history, it will have the script settings in the history.
Another way (that I use, maybe because I am old school) is to save the log of stretches as a text file. I know this isn't as slick, but it also retains what was done to all images, even those instances that create new images - which was . I know this requires one to go through the GUI/script again and enter/set the parameters, so some may not like this. It also has the advantage that it is essentially script version invariant.
A third way is to prepare both images you want to stretch prior to entering the script. You can quickly preview and change the target image to make sure the stretch is appropriate for both images, and then execute sequentially.
Hopefully, one of these is satisfactory in the meantime.
Cheers,
Dave
Hi Roman
As Dave says, there is a new version in the final stages of testing which will address this issue. The image history will record all relevant stretch parameters and provide a script instance icon that can be dragged to the workspace and, from there, dragged onto another image to repeat the stretch with those parameters. I hope to release the new version shortly and ask for your patience in the meantime.
CS
Mike
|
You cannot like this item. Reason: "ANONYMOUS".
You cannot remove your like from this item.
Editing a post is only allowed within 24 hours after creating it.
You cannot Like this post because the topic is closed.
Mike Cranfield:
David Payne:
Roman Pearah:
One thing that was changed with v2 was that the PixelMath processes that are injected into a view's history are no longer fully defined expressions but merely references to a temporary view: _ghs_temp. This prevents using processes from history to stretch other views or from having a real record of the stretches embedded in the image. This might have been a necessary change to support real-time previews or just a performance tweak, but having processes in history that are reusable and self-contained is a preferred pattern I think.
Hi Roman,
Mike will provide a better answer, and perhaps he can incorporate an option to save the Pixelmath instance as an icon, but such stretches done with Pixelmath would only be applicable for RGB/K and not be valid for Lum, Saturation, or Colour Enhance stretches (at least I don't think) because other processes must also be called.
One change Mike has made is to enable the script to be iconified with the current settings so that it can be applied to another image. Additionally, the icons setting can be extracted from file history for reapplication to a second image. (I am hoping these are effective in the current release, if not they will be in the next release update coming shortly). So while this doesn't/wont have the individual process settings in the history, it will have the script settings in the history.
Another way (that I use, maybe because I am old school) is to save the log of stretches as a text file. I know this isn't as slick, but it also retains what was done to all images, even those instances that create new images - which was . I know this requires one to go through the GUI/script again and enter/set the parameters, so some may not like this. It also has the advantage that it is essentially script version invariant.
A third way is to prepare both images you want to stretch prior to entering the script. You can quickly preview and change the target image to make sure the stretch is appropriate for both images, and then execute sequentially.
Hopefully, one of these is satisfactory in the meantime.
Cheers,
Dave
Hi Roman
As Dave says, there is a new version in the final stages of testing which will address this issue. The image history will record all relevant stretch parameters and provide a script instance icon that can be dragged to the workspace and, from there, dragged onto another image to repeat the stretch with those parameters. I hope to release the new version shortly and ask for your patience in the meantime.
CS
Mike
Hi Roman
I just wanted to let you know that I have now released GHS version 2.1.0 which addresses this issue that you raised about the history recording.
CS
Mike
|
You cannot like this item. Reason: "ANONYMOUS".
You cannot remove your like from this item.
Editing a post is only allowed within 24 hours after creating it.
You cannot Like this post because the topic is closed.
Roman Pearah:
So many great additions in v2. One thing that would be useful in the next version would be a way to send the value you select on the histogram to one or more of the parameters. One thing that's still painful (and the videos make this clear) is having to type values that you discover you want to use into the SP or other fields manually. A click-and-send functionality would really speed things up.
Hi Roman (and anyone else perhaps trying to "learn" the GHS transform),
Thought I would just add to the reply on this quote..... and also address some of the comments that I hear regarding not knowing how to set parameters,
Through my own experimentation I have come full circle on my thoughts on the "best" method to pick the parameters for the initial stretch. This method isn't foolproof and is subject to taste of course, but here it goes....
1) Once you have loading your linear image into the script, zoom in on the histogram and choose an SP to the left of the histogram peak, but within the area that is visibly, on a linear histogram basis, above the 0 line - precise placement isn't super critical at this stage.
2) Set b to a high level 10-15 (I usually use 15 now), leave LP and HP at 0 and 1, and then zooming out of the histogram view) slide D to place the histogram peak at or above about 1/4 away across, watching the image preview to make sure you can see all of the background and subject matter comfortably. For most images (unless the entire image is subject matter that you want to show), the contrast will likely be fairly low. (This is because we likely picked this initial SP so low, that we put a lot of contrast to the left of the histogram).
3) Pull up the Image Interrogator and show the preview mode. What we want to do here is show the preview mode so we can see our way around, but what we are actually interested in the "before" value of pixels as shown in the upper left window. What we are interest here is the before values for the dimmest parts of the subject matter (the dimmest parts of what you want to show against the background). Click on a couple of spots in the image and mentally average the R,G,B values (if in colour) and average the before value of the various spots (or the minimum) .
4) Exit the Image Interrogator and enter that estimate for into the text box for SP. (Now I know this involves typing a number, and Mike and I are looking at ways to avoid/streamline this). This value of SP should be to the right (higher value) that you used to create the preview. If this is not the case, use a lower SP for your image interrogation/enquiry. For images, that for most of the area, contain just background you may end up with an SP value well to the right of the histogram peak. For images that are entirely covered with subject matter, it will likely remain to the left of the histogram peak, but somewhat to the right of your initial SP pick.
5) Once you enter the number and hit <return>, you will see the image and histogram change - likely the histogram peak will shift back to the left. What we have done to the image is place that maximum contrast right where the subject matter emerges from the background. If not, you may want to go back a couple of steps and adjust SP, but in most cases this is a pretty sure fire way to get a good value for the initial stretch SP. Take a look at the histogram/image and unless you are very lucky you will have to make some adjustment to b and D, now that we have established SP.
6A) On the extremes you will have as SP well to the right of the linear image histogram peak (see 6B or 6C) if this is not the case. In these cases you may have actually "bifurcated" or split into two the histogram and the image and thrown the histogram peak quite far to the left (the image will likely look awful). The only tricky part here, is that you will find reducing either b or D, or both will start to shift the histogram peak of the resultant image back to the right and reduce the "bifurcation effect", caused by actually placing too much contrast here. In most cases, you will want to remove any bifurcation of the histogram or the image preview by lowering D,b, and both - that way the image should smoothly transition from background to subject matter. You can differentiate between D and b to place the histogram peak where you want it as well. Since this likely represents background that you don't want to highlight in this case it will likely end up less than 1/5th the way across, but don't be overly concerned where the histogram peak is place. A more important goal of this adjustment is described in 6C.
6B) In this extreme, it is likely that your SP chosen is still to the left of the linear histogram peak. Your histogram may look fine, and your image may be ok, or even a little dark. If you haven't used the maximum 15 for your b value, you may consider increasing this. Otherwise you can increase or decrease D to see the dim features in the background that you are after. In most cases, this will involve placing the histogram peak at or to the right of 1/5th the way across, but for now don't be overly concerned where precisely the histogram peak is placed - see 6C and 7.
6C) In either case of 6A or 6B, I have found that my favourite view of images have a LOG histogram view (unzoomed) that, going right from the LHS of the log histogram view rises to a peak, then comes down and quickly transitions from its peak to a MONOTONIC (constant log slope) all the way to the RHS of the log histogram view. This results the "best" distribution of contrast for many images., understanding that you may have a good reason to deter from this, but in most cases, something like this will be your ultimate goal. Your adjustments of b and D should attempt to achieve this - ie trying to establish as best as you can, this monotonic log-histogram decline to the right of the histogram peak.
7) Once you feel you have done the best job you can, you may find you have lowered b even as low as 3 or 4 in this initial stretch. You should always check the RHS to see if the brightest stars are starting to accumulate. If so, you might want to add a dash of HP by lowering it from 1. You may also find that this helps (or hurts) in achieving the "monotonic decine" log histogram shape you are after. It can definitely also be used (decreases) to darken the image somewhat, but this is likely better reserves for a follow-up stretch. The opposite, in terms of lightening the image can be achieved by increasing LP from 0, but you will not be allowed to increase it above SP which will still be at a very low value as it refers to the linear image. Whether reducing HP or increasing LP - the goal is to ahieve, as best as you can a good distribution of contrast. When you are there, the image should look pretty good as well, so don't forget to check the preview. When satisfied, execute the initial stretch.
8) Remaining stretches should involve takling any remaining bulges in the log histogram profile. These bulges likely correspond to parts of the image that seem "flat" and need contrast to show detail. By looking at the bulges and using the image interrogator to find these "flat spots" in the image, place SP where you want contrast added in the image, and bulges in the histogram profile pushed down. In general use a higher b for sharp bulges, and a lower b for broad based ones, then D to achieve the result. At the same time you can use HP, LP to control the image brightening - keepin an eye as to where the transform sits relative to the "identity" line, and using HP to control both adjust "darkening" and the stars on the far right of the of the histogram.
Hope this helps. I didn't initially intend on making this a new tutorial, but thought I would post it as my own "field experience" of the script increases. As the experience increases (in addition to Mike's new features), I think the script gets better and better.
Cheers,
Dave
|
You cannot like this item. Reason: "ANONYMOUS".
You cannot remove your like from this item.
Editing a post is only allowed within 24 hours after creating it.
You cannot Like this post because the topic is closed.
Thank you David. In addition to your tips I really like the video by PaulymanAstro on the "Eric Coles Method" to balance the color chanels: The Eric Coles Method using GHS 2.0 - YouTube
Your script is a game changer and I certainly won't go back to any other stretching method.
Currently I work with multiple iterations. Between each GHS stretch I like to flick in a linear stretch to reduce the background levels and adjust the black point before starting the next GHS stretch. In my experience the linear stretch supports better separation by the next GHS stretch. You just have to avoid overdoing it, so just adjust the black point by a smidge in between your GHS stretches otherwise you'll kill nebulosity.
Clear skies
Wolfgang
Thank-you for this suggestion Wolfgang,
There are definitely a lot of ways to skin the cat. It was strange when Mike released the first version and we both realized that we, ourselves, didn't really know how to best use it. So additional tips like yours are definitely helpful - I am going to try your suggestion, the next time these clouds of mine disappear. I would love it if more fans of the script would provide their learnings/suggestions too!
Cheers,
Dave
|
You cannot like this item. Reason: "ANONYMOUS".
You cannot remove your like from this item.
Editing a post is only allowed within 24 hours after creating it.
You cannot Like this post because the topic is closed.
to create to post a reply.